
Summary-
The project includes an analysis of a Giant retail supermarket chain’s sales data for a period of 2.5 years using R to build a regression model for forecasting Sales and demand.
The project also includes exploratory analysis of the store data to review the effect of markdowns due to holidays on the sales. Do the markdowns and discounts help sales during the holiday season. Along with this there was also general insights about the sales across the various locations/outlets to identify stores with most sales and variation in sales across stores and across months etc.
You can view the full project code on this Github link
Note: This is an academic project completed by me as part of my Post Graduate program in Data Science from Purdue University through Simplilearn. The project was towards the completion of Data Science with R module.
Bussiness Scenario

One of the leading retail stores in the US, Walmart, would like to predict the sales and demand accurately. There are certain events and holidays which impact sales on each day. There are sales data available for 45 stores of Walmart. The business is facing a challenge due to unforeseen demands and runs out of stock some times, due to the inappropriate machine learning algorithm. An ideal ML algorithm will predict demand accurately and ingest factors like economic conditions including CPI, Unemployment Index, etc. Walmart runs several promotional markdown events throughout the year. These markdowns precede prominent holidays, the four largest of all, which are the Super Bowl, Labour Day, Thanksgiving, and Christmas. The weeks including these holidays are weighted five times higher in the evaluation than non-holiday weeks. Part of the challenge is modeling the effects of markdowns on these holiday weeks in the absence of complete/ideal historical data. Historical sales data for 45 Walmart stores located in different regions are available.
Analysis Steps
- Answer few questions based on Exploratory Data Analysis like:
- Find the store which has maximum sales and store with maximum standard deviation i.e., the sales vary a lot.
- Which store/s has good quarterly growth rate in Q3’2012
- Some holidays have a negative impact on sales. Find out holidays which have higher sales than the mean sales in non-holiday season for all stores together.
In this section we used the lubridate package to extract the Quarter from the Date variable. The function to extract quarters also provides option to select the fiscal start date.
Since the data starts from Feb-2010. We have checked the Quarterly growth under both situations. When selecting the fiscal start from the second month(Feb) and also when selecting fiscal start from the first month which is the default option. In both cases this causes the results to vary and the store with the sales best quarterly sales growth was a different store in each case.For the Holiday sales analysis we notice - Out of all the Holidays Thanksgiving has the max Average Holiday sales. We see that only for Christmas the Sales are below the Non holiday average.
- One must note that the total dollar-value of the sales is not a fair comparison between Non-Holiday v/s Holidays. Since Holidays normally have a markdown(discount). Due to the markdown and discounts during holiday the dollar($) amount (Price) of any given product is lesser.
- This means that while there could be a possibility that actual units sold were higher during holidays .The final dollar value of the Sales can actually be lesser or equal the Non discounted sales value during the normal period. So this comparison is dependent upon the amount of Holiday discount which is not specified in this analysis/dataset.
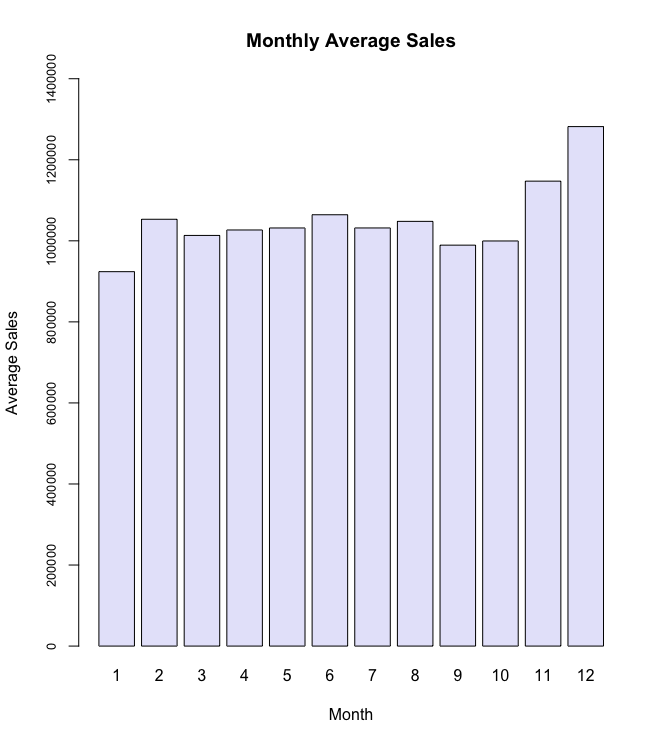
Creating a monthly and semester view of sales in units and insights on the same.
![Monthwise_sales]()
![Boxplot_monthly_sales]()
![Semester_sales]()
![Boxplot_semesterwise_sales]()
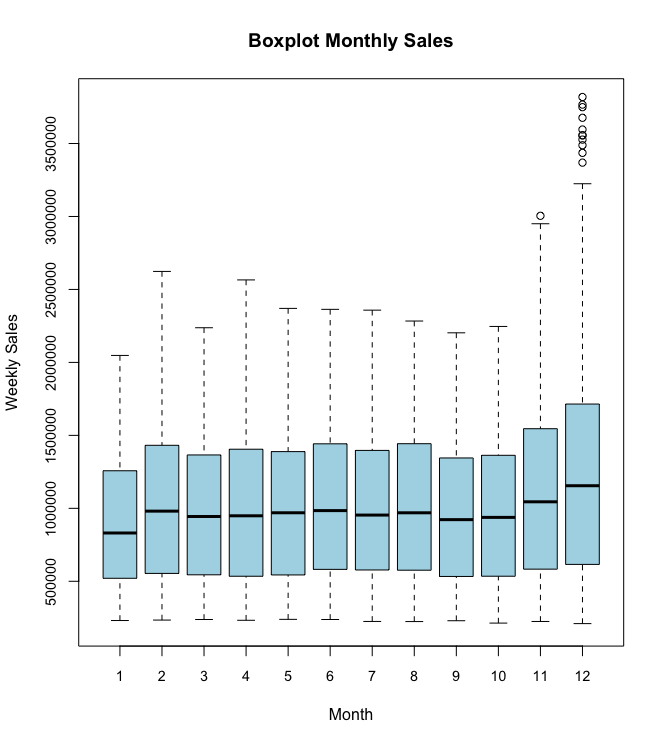
Monthly sales Insights :
- The average sales are highest in last part (i.e. months 11 and 12) of the year. January has lowest average sales (923884.6) and December average sales(1281863.6) is the highest.
- Also note that December has a higher Standard Deviation in the sales. The box plot also confirms this as there are plenty of outlier points on the higher side of the scale in December.
- Also there appears to be a dip in sales during September and October where the average sales is below 1000000.
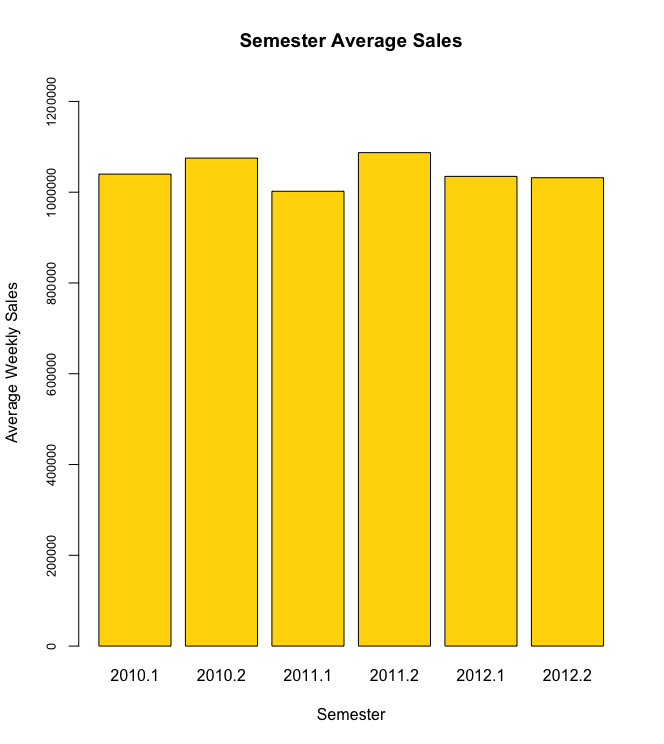
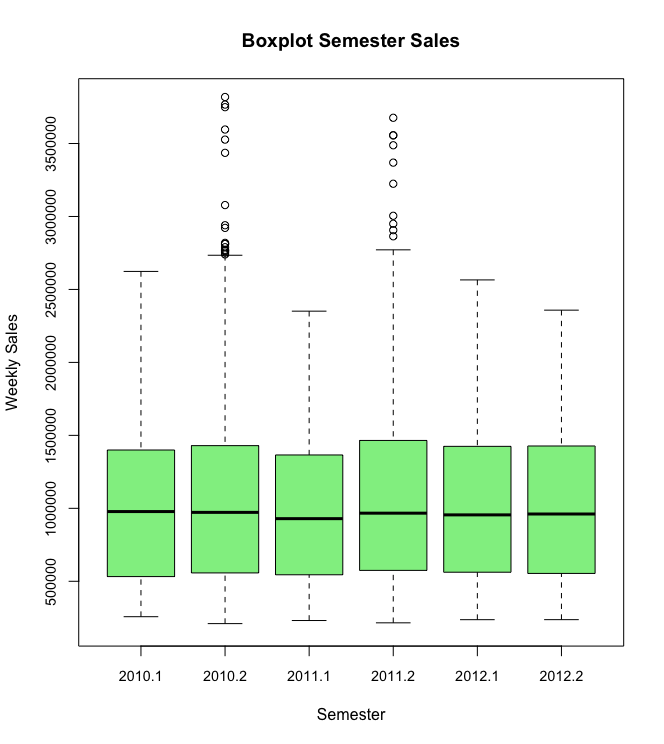
Semester sales Insights :
- On Average the 2nd Semester sales are higher than 1st Semester. Except for in the year 2012. This is logically conclusive as well since the monthly analysis validates that sales on average is higher in Nov and Dec months which fall in 2nd Semester.
- Note that for 2012- 2nd Semester data is incomplete/less as data was available only till October 2012. And as noted in monthly analysis the November and December month average sales tend to be the highest of all months in the year.
- Again we see a high variance of weekly sales in the 2nd Semester with a large number of outliers. This again follows from our conclusion in Monthly sales analysis which revealed high number of outliers for weekly sales figures in Nov and Dec.
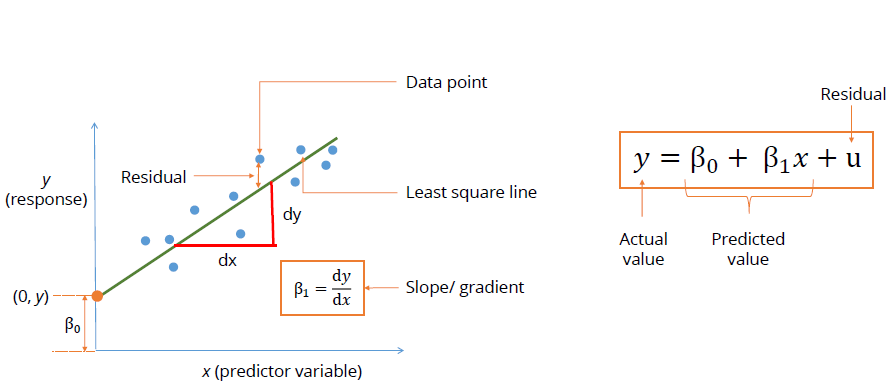
- Model Building:
Linear Regression models built and analysed for features leading to best possible accuracy and to ensure models contain features that are statistically significant.
Note: Model was created for only store #1 specifically under this project as per the stated requirement. For the store there was only 143 samples. It would be advisable to have more data per store if we want to specifically focus on creating a model for one store. Else a general model could be created by ingesting the data across stores using the other predictive feature variables- First build a general model for demand - with all of the variables first and then test various methods to improve models. We have then proceeded to analyse features to identify features which are statistically significant by reviewing the p-values for each variable. Using a base level of significance at 5% for our test. We eliminate the variables where p-value was more than the significance threshold of 0.05 and refine the model successively.
- At each revision we review the adjusted R-squared as well which shows how well the model explains the target variable(sales) based on the predictor variables. Next revised the Model using Akaike information criterion (AIC) Statistical algorithm. Using this we obtained a model with adjusted R-squared of 0.3384. But even this is very low to be considered for deployment by bussiness for the forecasting sales.
- Next we have analysed the models for multicollinearity between the variables using VIF. Note that the categorical variables have no VIF data. Run the VIF step algorithm and it eliminates variables which have a collinearity problem using VIF threshold of 5. This results in a final model with only Temperature and CPI. But this model has a very low adjusted R-squared of 0.1012. Again this model does not have any categorical variables as VIF cannot be applied to categorical features. However as per the previous step the best model we could build had a maximum adjusted R-squared of 0.3384.
- To conclude the data is insufficient/less or we need other features which would be more significant in terms of predicting the target variable(weekly_sales).
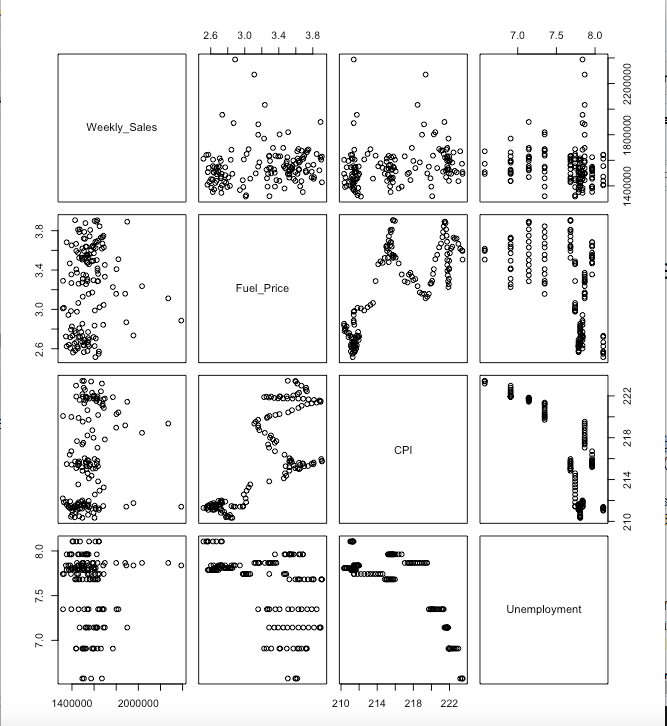
Hypothesize if CPI, unemployment, and fuel price have any impact on sales.
![Correlation_pairplot]()
Our review of the hypothesis revealed that out of CPI, unemployment, and fuel price. Fuel price does not have a significant impact or effect on the target variable (Weekly_Sales). CPI and Unemployment have statistical significance and their coefficients have a low p-value. However with the model having a very low adjusted R-squared (0.06524) this means they can explain very little of the variation in weekly sales. So while they do have an impact on sales however the impact is very weak or low and cannot successfully help predict the target variable.
- Conclusions and select the model which gives best accuracy.
Overall none the models result in sufficient scores to qualify for being used to forecast weekly_sales. However as mentioned before this could be due to the model being narrowed down to only one store which reduces the number of samples for training significantly. While it does make sense that predictions would vary from store to store based on region, location and store-size being some basic factors causing variances, yet we also need to explore a general model independent of store or have sufficient data for each store to train a specific model for the store. Also bussiness needs to explore other features which may better predict sales.
Tools used:
This project was completed in R programming lanuage and used various statistical packages within R like dplyr, lubridate, sp, raster, usdm