Summary-
This is a Natural Language Processing project which includes analysis of buyer’s reviews/comments of a popular mobile phone by Lenovo from an e-commerce website. Analysis done for the project include pre-processing of text data such as word-tokenisation, lemmatisation. This is followed by Topic-modeling using Latent Dirichlet Allocation, POS tagging, and topic interpretation for business use
You can view the full project code on this Github link
Note: This is an academic project completed by me as part of my Post Graduate program in Data Science from Purdue University through Simplilearn. This project was towards the completion of Data Science Natural Language Processing (NLP) module.
Bussiness Scenario
A popular mobile phone brand, Lenovo has launched their budget smartphone in the Indian market. The client wants to understand the VOC (voice of the customer) on the product. This will be useful to not just evaluate the current product, but to also get some direction for developing the product pipeline. The client is particularly interested in the different aspects that customers care about. Product reviews by customers on a leading e-commerce site should provide a good view. Analysis to be done: POS tagging, topic modeling using LDA, and topic interpretation
Objective
Help the business understand the voice of the customer by analyzing the reviews of their product on Amazon and the topics that customers are talking about. Perform topic modeling on specific parts of speech. Finally interpret the emerging topics within the reviews for business.
Analysis Steps
- Load the data - Read the .csv file using Pandas. Take a look at the top few records.
- Data Pre-processing :
Before we proceed to perform our analysis we shall begin with some pre-procesing tasks to clean up the data and make it ready for topic modeling. We can make the text lower case first and then apply tokenization to break each individual review into seperate words. Following this we can perform Part-of-speech tagging, lemmatization and finally remove stopwords and punctuations which are not relevant to the topic modeling task.- Normalize casings (convert to lower_case text) for the reviews and extract the text into a list for easier manipulation.
- Tokenize the reviews using NLTKs word_tokenize function.
- Perform parts-of-speech tagging on each sentence using the NLTK POS tagger. POS tagging helps us filter out text based on the part of speech that would be relevant to us.
For example - When the requirement is to analyze names or places mentioned in a document, then we would want to specifically narrow our focus towards nouns within the text.
OR if the requirement was to analyse the way people describe the subject of a text then we can tune the analysis to focus on the adjectives. - For the topic model, we want to include only nouns.First we can find out all the POS tags that correspond to nouns and then limit the data to only terms with these tags.
- Lemmatization - Different forms of the terms need to be treated as one. Example - Very simply lemmatization reduces various forms of the same word to the base word. So eat, eating, eater, ate would be converted to the base word “eat” across the multiple occurances within the text.
- Remove stopwords and punctuation (if there are any).
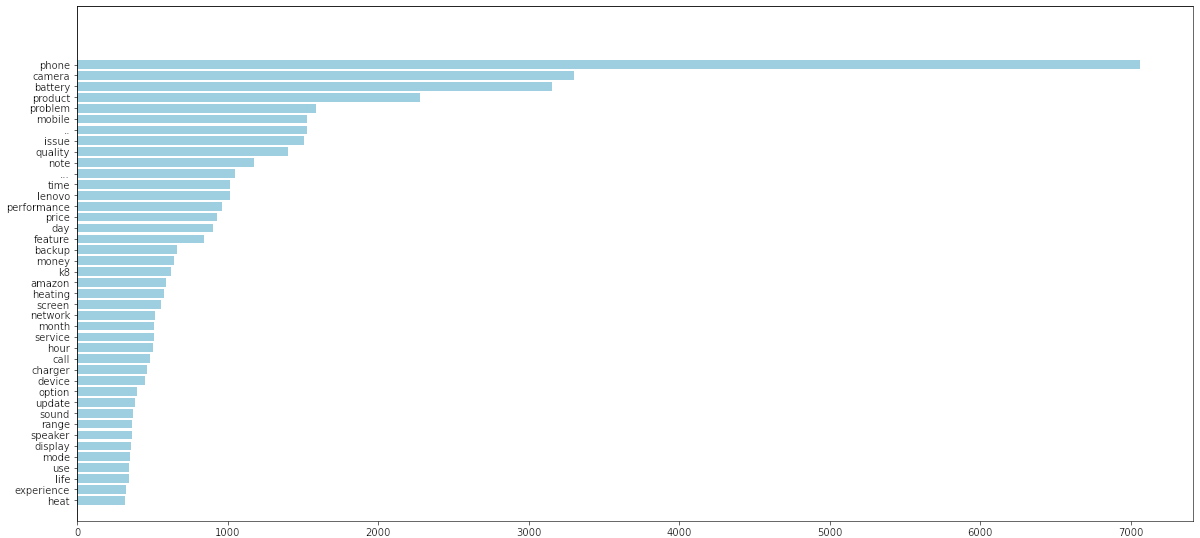
Notes : After performing the pre-processing the number of reviews reduced from 14675 to 13453. We can still see some inconsistent items in the list of review words such as combined words like discharged.this and process.android.com. Also emoji’s are part of the text which are not relevant and need to be further removed. Next we can review the common words by creating a plot of the most common words.Following which we can do another round of stopwords and punctuation removal
- Next we shall visualize the list of words by creating a barplot of the most common/frequently occuring words in the reviews text.
- We first use FreqDist to find the most common 100 words.
- Then build the visualization in a barplot using matplotlib.
![Freq plot of most common words 1]()
The analysis reveals following - - There are some punctuations that still appear in the word tokens like ‘..’ and ‘…’ - Also the list consists of emojis which are not relevant for topic modeling - Further there are also just numbers - e.g. ‘1’ and ‘2’ which are not relevant - And we can also remove the obvious and contextual stop words from the topic modeling perspective . These are context Words like ‘phone’,’lenovo’,’mobile’,’k8’,’product’.
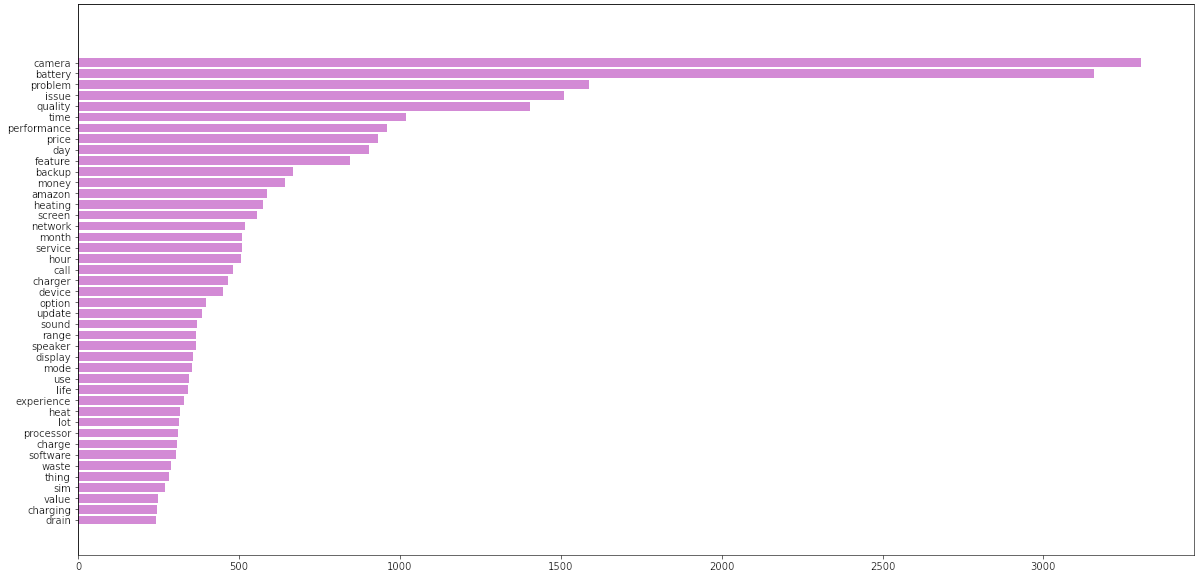
Based on the above review we can refine and add more stopwords and items to be removed. The removal can be done using string functions like isalnum() which checks if a word token is alphanumeric. Also elminated tokens which are only a single alphabet by checking len(word)!=1.
Through this pre-processing we have now narrowed down the reviews to the most relevant words/nouns in the text for the topic modeling phase. Again we have plotted the most common words after this second round of word filtering.![Freq plot of final words]()
- Model Building :
Create a topic model using LDA on the cleaned-up data with 12 topics.- Print out the top terms for each topic.
- Check the coherence of the model with the c_v metric. Now we create the topic model using Latent Dirchlet Allocation algorithm.
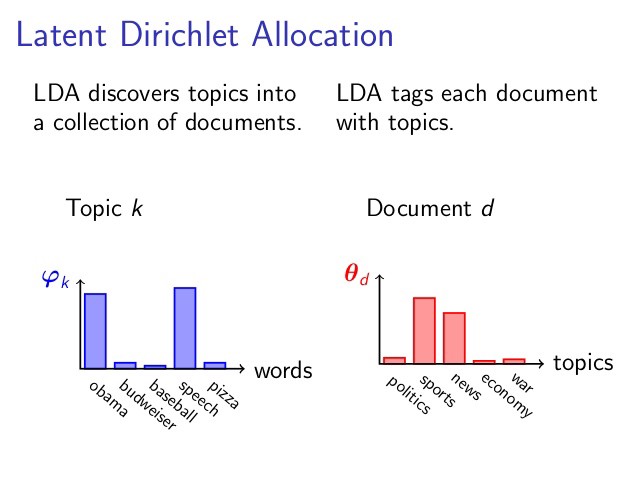
Latent Dirichlet Allocation (LDA) is a “generative probabilistic model” of a collection of composites made up of parts. In terms of topic modeling, the composites are documents and the parts are words and/or phrases (n-grams).
In simple terms LDA tries to create a model of what words appear in a particular manner or context together based on the frequency distributions and it aligns/classify the words into different topics. Furthermore it segments the entire corpus/document into these topics.
Example : If we consider a news article . A given article could be based on only a few topics. Like an article in the sports section will largely focus on sports. At times the article may refer to some related topic like science if the article relates to some advances or findings in sports nutrition or excercise etc. But for the most part we can usually infer that a single article is mostly homogenous when it comes to the topics that it consists of. Again within a given topic like sports one can expect some words to be more frequent than others. E.g. In a sports article we are more like to see words like - ball, score, half-time, innings rather than words like data-science, javascript, python, C# , Machine learning.![LDA explainer]()
So the LDA algorithm performs this sorting or clustering of documents into a collection of topics and further it creates the topics by allocating words to the topics. The algorithm uses a frequency based (i.e. probabalistic approach).Like how many times does a particular word appear in the topic and how frequently is the topic part of the document. Based on this it creates a model of the document in an unsupervised fashion. The topics themselves like sports, politics, fashion are not named by the algorithm, this is up to the analyst to decide on the topic names based on the collection of words. So similar to clustering algorithms it creates clusters but it cannot actually describe what the specific category/cluster in the data is and such inference is drawn by manual/human review.
The quality of the model can be determined using a metric called the c_v coherence metric. Coherence measures the relative distance between words within a topic. The overall coherence score of a topic is the average of the distances between words
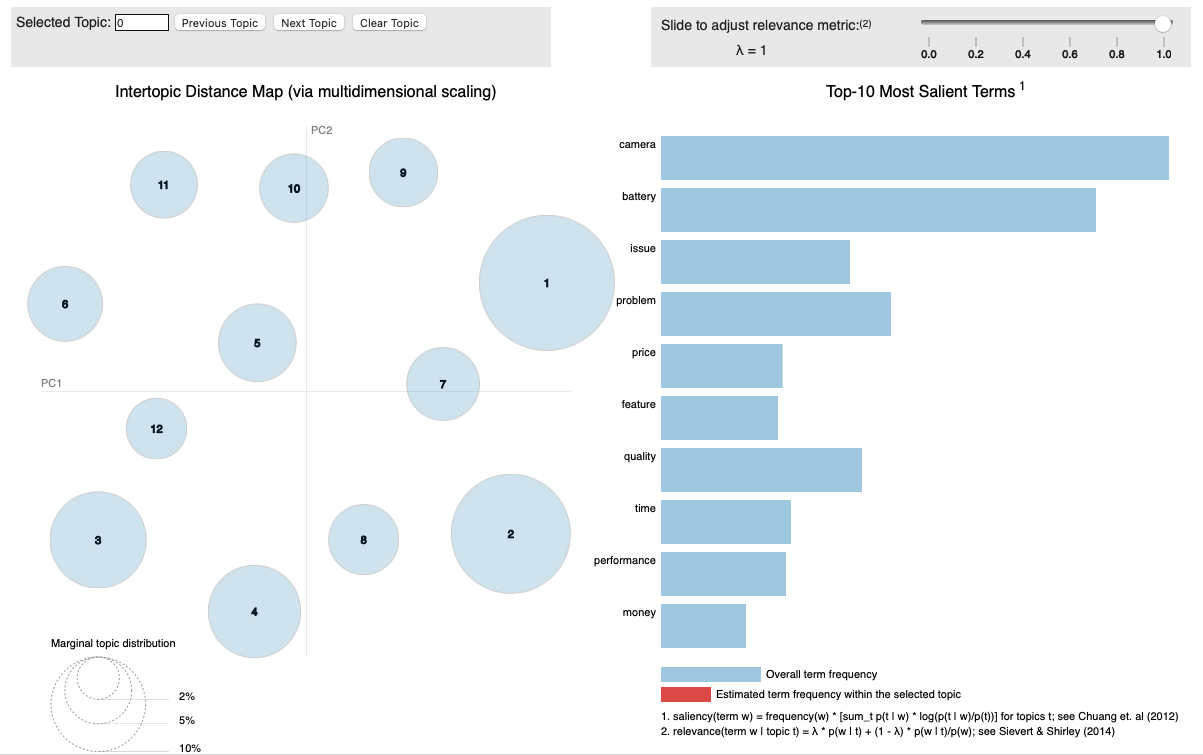
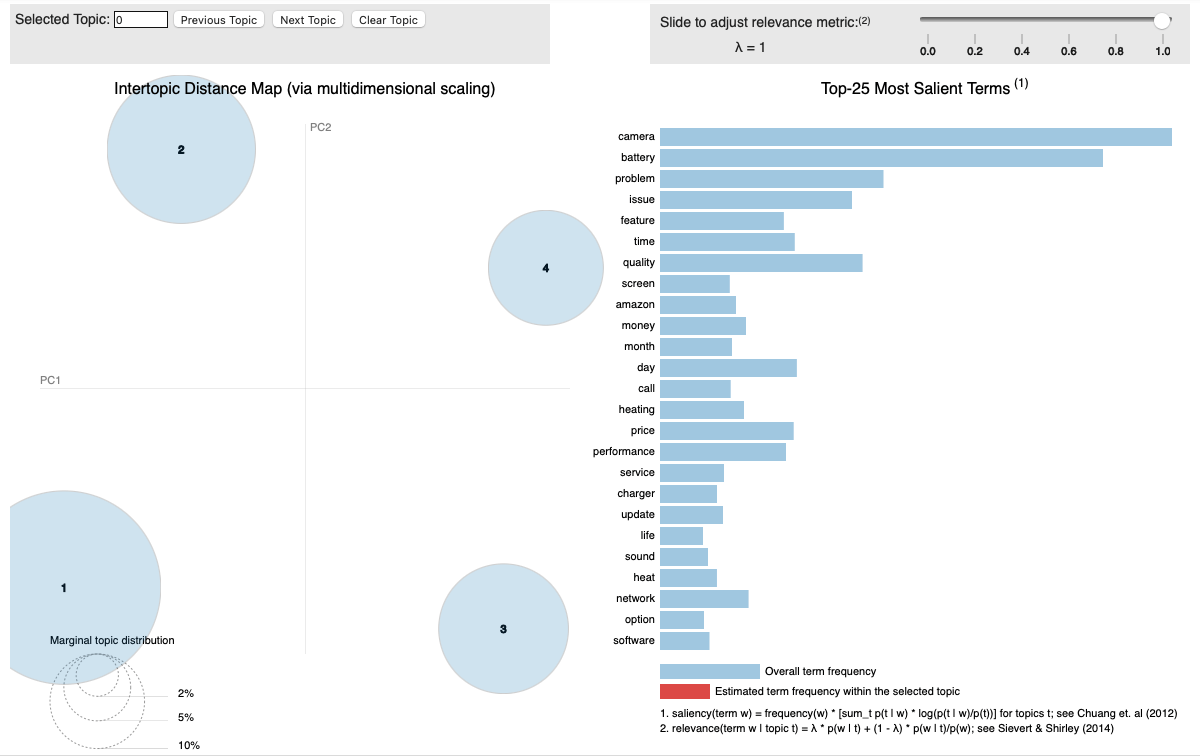
Next we analyze the topics through the business lens and determine which of the topics can be combined. While we started with the initial 12 topics. There may be a good amount of overlap between the topics. So we can review if some of the topics could be combined.
![pyldavis-1]()
- Next we can create a refined topic model using LDA with the optimal number of topics as per previous analysis and check the coherence of the new model.
- Since the business should be able to interpret the topics per the objective of the project.
- Assign a relevant name for each of the identified topics.
- Create a table with the topic name and the top 10 terms in each topic to present to the business.
- We have also created a interactive visualization using pyLDAvis library to show the topics and the most popular terms within the topics
![pyldavis-2]()
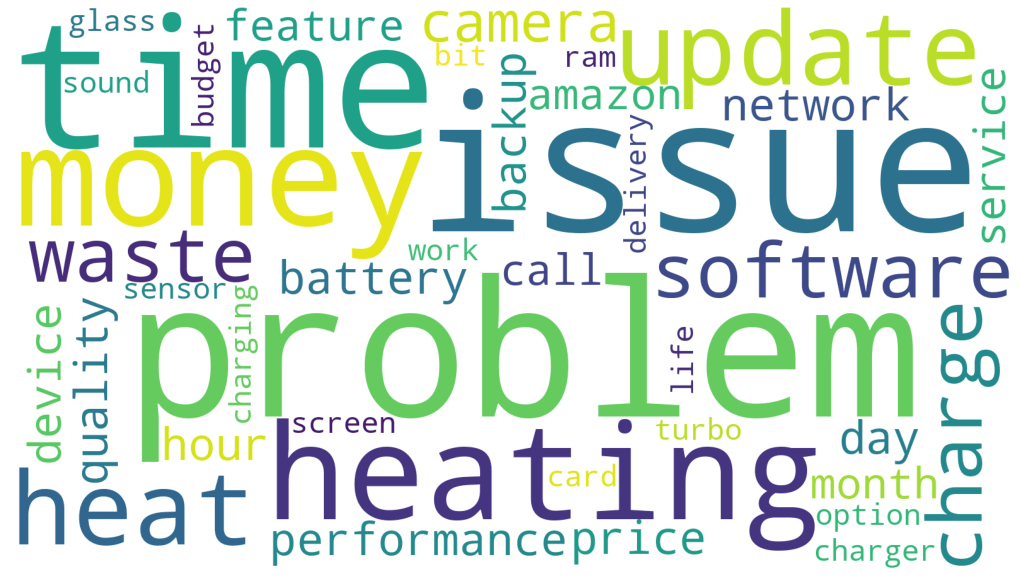
Lastly we have created a simple wordcloud to vizualize the most popular and frequent words in the dataset.
![wordcloud]()
Tools used:
This project was completed in Python using Jupyter notebooks. Common libraries used for analysis include numpy, pandas, nltk, gensim, matplotlib, pyLDAvis

