Summary-
The project includes analysis on the California Housing Dataset with some Exploratory data analysis . There was encoding of categorical data using the one-hot encoding present in pandas. Also standardization of the data and use of Linear Regression models from sklearn and Seaborn plots
You can view the full project code on this Github link
Note: This is an academic project completed by me as part of my Post Graduate program in Data Science from Purdue University through Simplilearn. The project was towards the completion of Data Science with Python module.
Bussiness Scenario
The US Census Bureau has published California Census Data which has 10 types of metrics such as the population, median income, median housing price, and so on for each block group in California. The dataset also serves as an input for project scoping and tries to specify the functional and nonfunctional requirements for it. The project aims at building a model of housing prices to predict median house values in California using the provided dataset. This model should learn from the data and be able to predict the median housing price in any district, given all the other metrics. Districts or block groups are the smallest geographical units for which the US Census Bureau publishes sample data (a block group typically has a population of 600 to 3,000 people). There are 20,640 districts in the project dataset.
Analysis Steps
- Load the data : Read the “housing.xlsx” file and print first few rows of the data.
When we check the dataframe info we notice that there are missing values only for column total_bedrooms and on further review the missing value is for 207 rows in the data which is a smaller proportion of the total samples. - Data-cleansing - Handle missing values :
Missing value only for total_bedrooms which is a small portion of the total samples. So we can fill the missing values with the mean of the total_bedroom - Data Pre-processing-I :
- Extract input (X) and output (Y) data from the dataset. The target column (y) is median_house_value and the remaining columns can be features. We have dropped longitude and latitude from the features as per the below note.
Note: As longitude and latitude only define the block these columns are excluded from the features. As the objective is to create a linear regression model to predict housing prices or values in any district. So the location which is indicated by the block (in this data set the longitude and latitude variables) would not be relevant in the model building. - Encode categorical data : Convert categorical column in the dataset to numerical data. The only categorical variable i.e (Ocean proximity) has 5 unique values. So we can perform a one-hot encoding for the different values of the variable. For this instance we are using the pandas get_dummies function and then dropping the original column.
- Extract input (X) and output (Y) data from the dataset. The target column (y) is median_house_value and the remaining columns can be features. We have dropped longitude and latitude from the features as per the below note.
Exploratory Data Analysis :
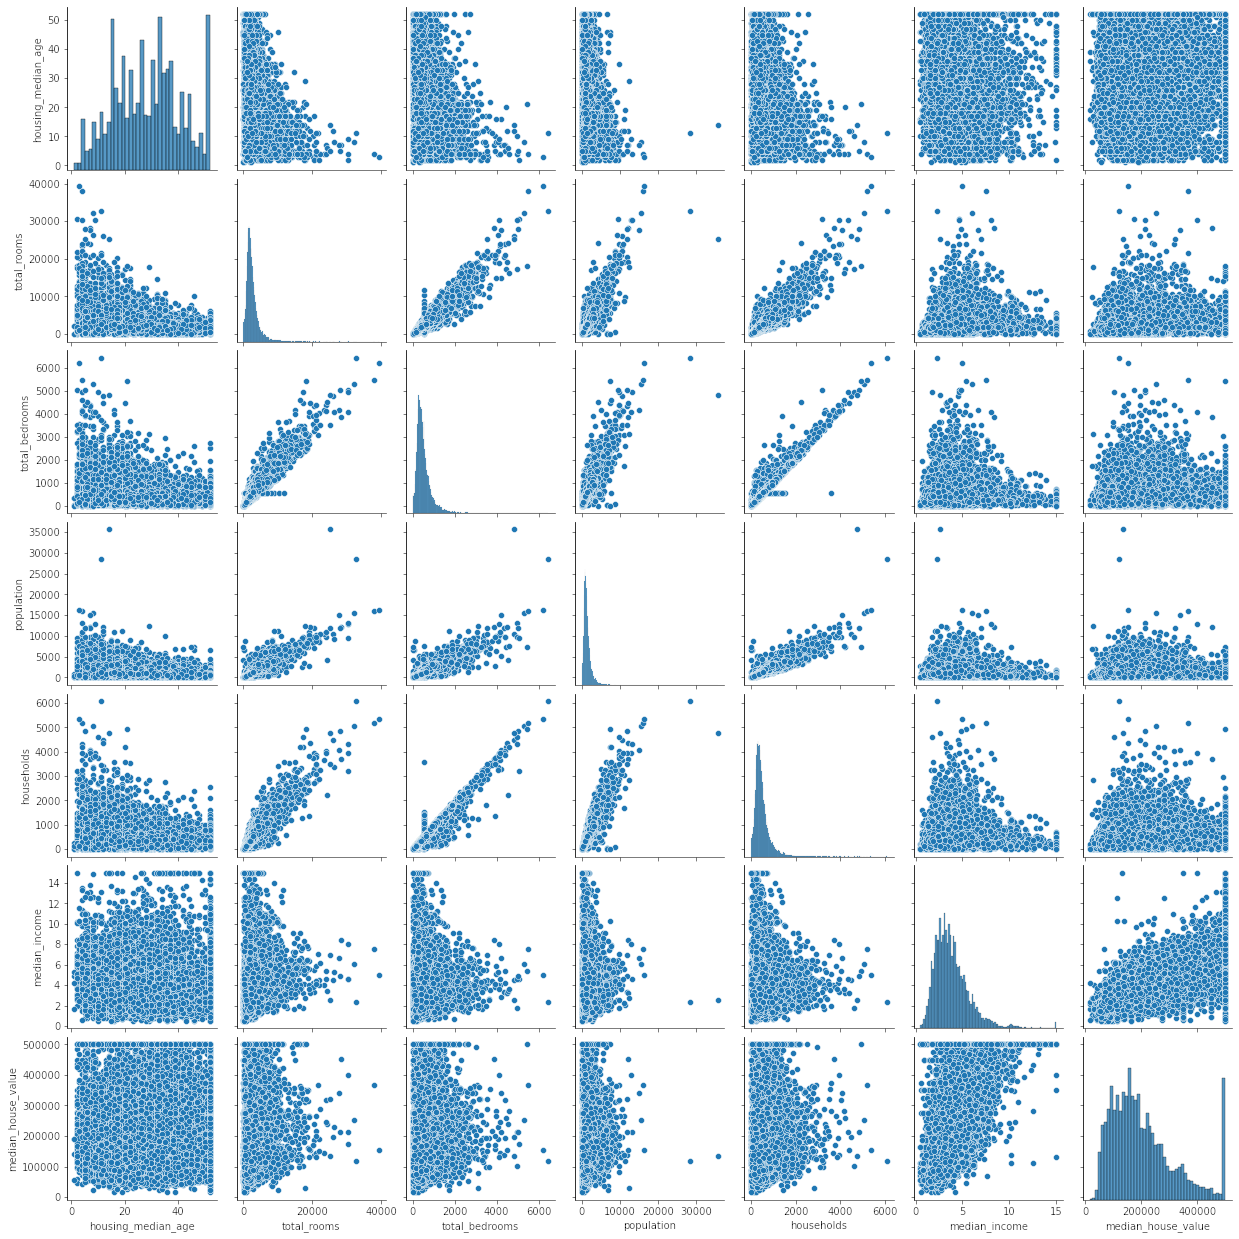
Perform some basic EDA to review the features and correlation![Pairplot between feature variables]()
Observations : There are no strong trends between median_house_value and any other feature variables other than median_income. Also a linear relation is seen only between ‘households’ and ‘total_rooms’ and ‘total_bedrooms’ which follows logically.
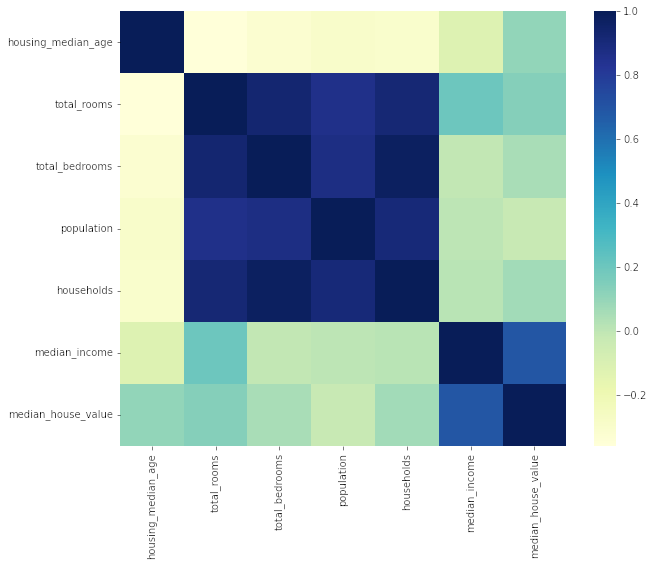
![Correlation Matrix]()
Observations : From the correlation matrix we can see that median_house_value is more closely correlated to median_income in general. So this would be ideal feature to utilize in our regression model. As reviewed earlier from scatter plots - correlation is high between ‘population’, ‘households’ and ‘total_rooms’ and ‘total_bedrooms’ .
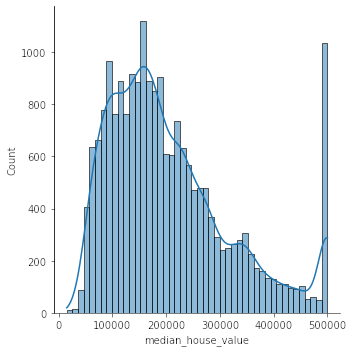
![Distribution of house prices]()
Observation : We have also created a distribution/histogram plot of the target variable y (median_house_value). We note that the house prices have a certain level of skewness as there is a large number of samples where the house price is 500,000 which is comparable to the peak of the distribution around 160,000.
- Data Pre-processing-II :
- Split the dataset into 80% training dataset and 20% test dataset.
- Standardize training and test datasets. This will bring all the variables to the standard scale so the mean is 0 and variance is 1 after scaling.
- Perform Linear Regression :
- Perform Linear Regression on training data.
- Predict output for test dataset using the fitted model.
- Print root mean squared error (RMSE) from Linear Regression.
In Linear Regression models we try to create a linear equation also known as the line of best-fit through the data.Under simple linear regression we create a linear equation between the target (dependent) variable (y) and only one predictor (independent) variable (X) \[ y= {Mx+C} \] Under Multiple linear regression we form the linear equation between target(dependent) variable (y) and multiple predictor (independent) variables (\(X_1, X_2, X_3\)…so on) \[ y={B_0+B_1X_1+B_2X_2+B_3X_3+….+B_nX_n}\] Finally we can measure the model accuracy using various metrics. The most common ones being the R-squared, Adjusted R-squared and RMSE. \[R^2 = {1-\frac{SumOfSquares_{Residual}}{SumOfSquares_{Total}}} \] \[RMSE = \sqrt{\frac{\sum_{i=1}^{N}(x_i-y_i)^2}{N}}\]
Adjusted R-squared is a very standard metric in regression and helps to measure how much of the variation in the target variable(y) is explained by the independent predictor variables. The higher the score, the better the model is at predicting the target. RMSE in simple terms is the square root of the mean of squared deviations between actual and predicted values by the model.
We have implemented regression using the sci-kit learn library. The metrics are also present within sci-kit learn. Note that there is also another package statsmodels which can be used for implementing regression in Python. The output also contains lots of metrics on the created model.
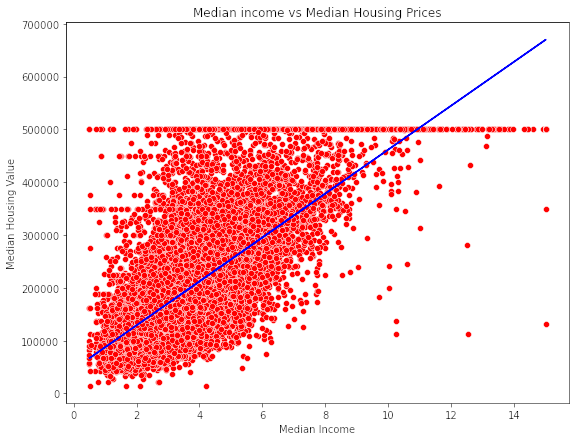
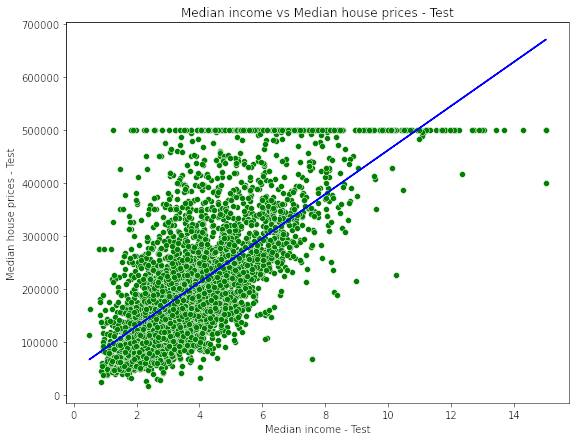
- Additional analysis : Perform Linear Regression with only one independent variable
- Extract just the median_income column from the independent variables (from X_train and X_test).
- Perform Linear Regression to predict housing values based on median_income.
- Predict output for test dataset using the fitted model.
- Plot the fitted model for training data as well as for test data to check if the fitted model satisfies the test data.
![Plot of fitted model on Training data]()
![Plot of fitted model on Test data]()
Tools used:
This project was completed in Python using Jupyter notebooks. Common libraries used for analysis include numpy, pandas, matplotlib, seaborn, sklearn

